The rise of AI, exemplified by the groundbreaking ChatGPT, has sparked intense curiosity across the computing industry. As businesses explore the implications of AI in their respective domains, observability emerges as a critical focus. In this blog post, we delve into the fascinating world of AI and observability, unraveling its impact on various observability sub-functions, and how observability contributes to the success of AI systems.
How AI is going to transform observability
In this section, we will explore how AI impacts the specific sub-functions of observability:
Instrumentation and Collection
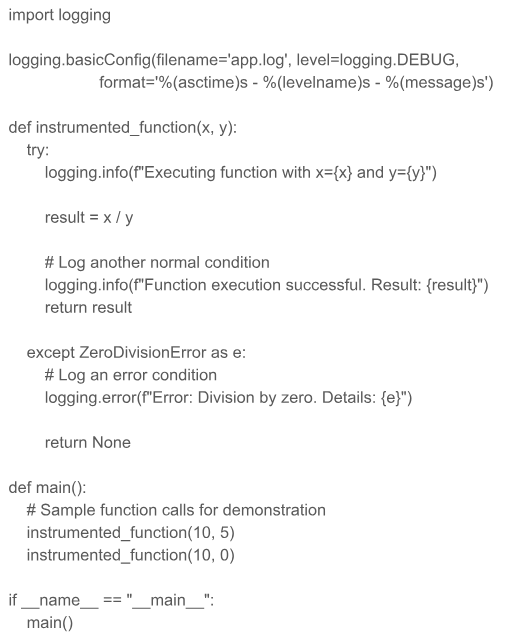
Developers typically add code snippets in their applications to generate logs, metrics, or traces to gain insight into the runtime behavior. Resulting observability data provides the basis for developers and support teams to manage the application life-cycle. For instance, a developer writes a function to process two incoming values (division in this case) and ends up with following function:
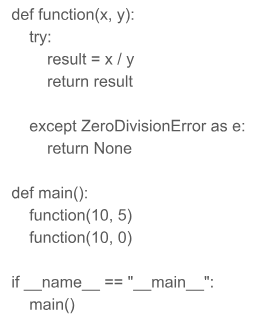
Above code has no issues except that when function hits an exception condition, there is no way for anyone in the support team to know what is happening while they may have to deal with its collateral damage elsewhere.
This is a typical scenario where AI can help. We can ask it to add instrumentation in the function so that normal and error behaviors of the function execution are logged. We literally asked this question along with above snippet to ChatpGPT and it produced the following code:
When this code runs in production, it will log each function invocation in the app.log file in the production environment. That production environment can be a server, a VM, or a container. Production teams typically run log collection agents to collect logs from such files and send them to their logging backend. Assume that our production environment runs logstash as an agent that forwards all logs to Elasticsearch backend. Developers can again go back to ChatGPT and ask it to generate a config file so that their application logs are onboarded to Elasticsearch. When we asked that from ChatGPT, it generated following configuration file:
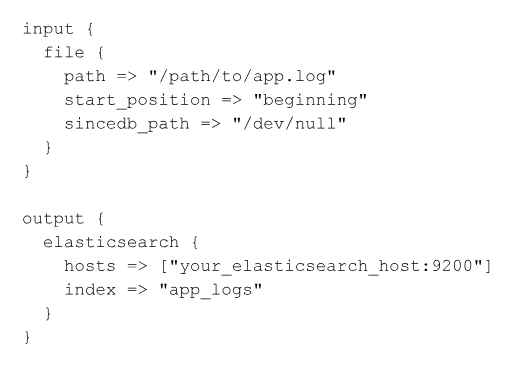
This needs further tweaking by telling ChatGPT the path to the log file as well as the server name and port of destination Elasticsearch service. This file will need to be placed among other logstash configuration files and logstash service will have to be restarted to enable that onboarding.
It is clearly possible for an AI co-pilot to get one or multiple functions and instrument them with appropriate observability data collection. Target observability data can be logs, metrics, or traces. Observability systems are already capable of automatically onboarding new additions to observability data that they already forward. Triggers for such instrumentation and collection can be other AI systems that may have detected an anomaly due to one or more functions and may need runtime visibility to determine its root cause.
Leveraging AI for smarter instrumentation and observability data collection will enable comprehensive insight into complex application when and where it is needed during operation. It will open up new opportunities for automated workflows that were not possible without Generative AI.
Ingestion
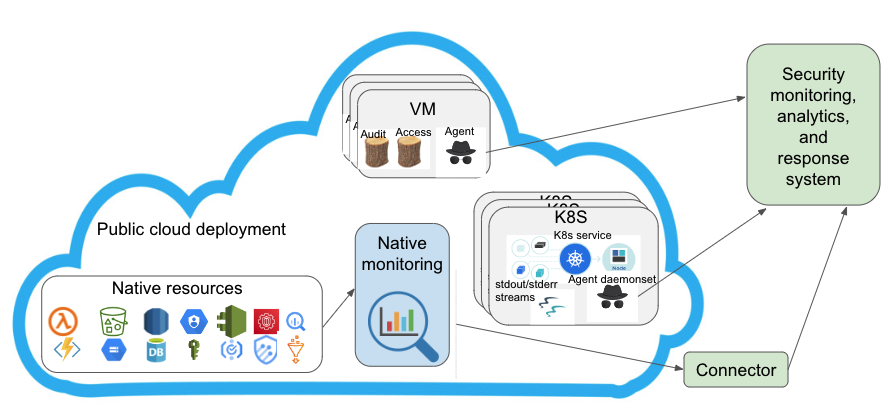
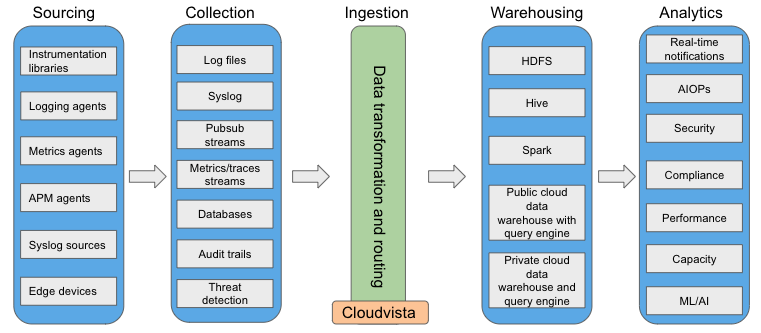
A typical production environment consists of diverse types of infrastructure and services. Infrastructure can consist of physical compute, storage, networking, and security devices as well as VM and containers. A typical public cloud environment will also include its native resources, such as serverless compute, block storage, databases, auditing, identity, and so on. Many services will utilize one of more of these infrastructure resources at the same time. Observability data originating from these diverse sources will need to be ingested into an organization’s common data backend, which can be a data lake or warehouse.
Ingestion can be broken down into its own sub-components:
- Source isolation through data reception
- Normalization
- Routing
Ingestion can be considered as an edge service that receives observability data from a local cluster or a set of application instances. It may accept observability data payloads through a REST endpoint with clear API specifications. Ingestion is a critical component of to ensure a loss-free data handling, proper categorization, enrichment through meta-data, and routing to required destinations.
Data Reception
Ingestion provides an endpoint that isolates the data sources from observability backend. Thus, an agent sending observability data to an ingestion endpoint considers its forwarding successful when the ingestion endpoint receives and acknowledges them.
In addition to isolating from source, ingestion endpoint routes the observability data to appropriate destinations. Logs, metrics, and traces may need to be routed to specific destinations based on type of data or configuration settings based on downstream applications.
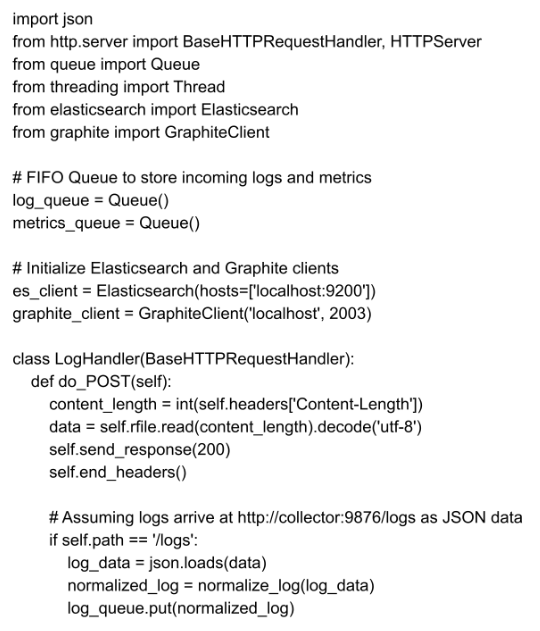
Following python code implements an ingestion endpoint to receive multiple types of sources with endpoints specifying their destinations:
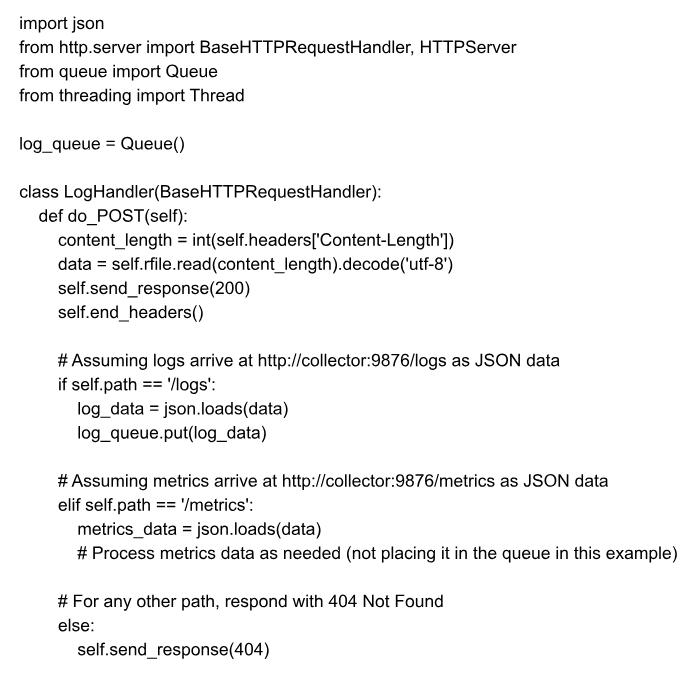
This type of observability reception endpoint serves a few specific purposes:
- Path to add new sources of observability data on the fly
- Addition/modification of configuration that creates rules to route specific sources to destinations
- Definition of meta-data key-value pairs that will be added to specific data types
- Processing of user input to manage observability data
- Transformation of selected types of data from one format to another. For instance, logs to metrics or metrics to down-sampled metrics, etc
- Maintaining statistics about observability data processing functions of the ingestion module.
AI will enable most (if not all) of the above activities to take place in real-time. Through various triggers, system can enable new observability data sources, rules to route them to appropriate destinations, meta-data to appropriately enrich the incoming raw observability data, custom processing for specific data types, transformation, and statistic collection. All of these functions may require dynamic code generation or appropriate APIs to implement above functions dynamically.
Normalization
Observability data from diverse sources typically needs to use same backend analytics or reporting setup. That requires all incoming data to conform to an agreed-upon schema within an organization. That can help consistent handling of data from multiple sources by diverse internal teams to accomplish their specific tasks.
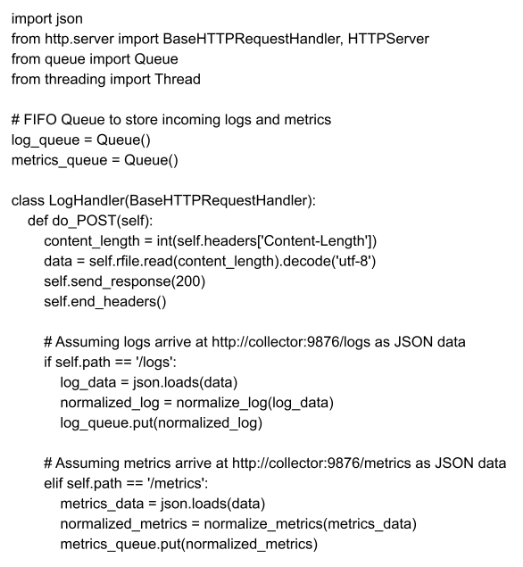
Following example extends the data collection endpoint with normalization, such that each data type (i.e., log or metric in this case) has three meta-data components:
- Source
- Service_name
- Service_group
Values of these keys can be sourced from configured APIs or environment variables.
Routing
Routing involves picking up the incoming observability data records from incoming FIFO queue, applying appropriate rules to them, and forwarding to an out-going queue based on the intended destination.
Using our running example of ingestion endpoint, we can extend the processing functions for logs and metrics to forward them to elasticsearch and graphite backends, respectively.
Ingestion service plays a pivotal role with AI to close the feedback loop with observability to take real-time actions to remediate infrastructure and service level problems.
Analytics
Analytics is currently an offline component to allow batch processing of ingested data in the observability backend. There are some examples where observability data can be processed in a streaming fashion for near-real-time extraction of specific patterns (for instance, using Spark).
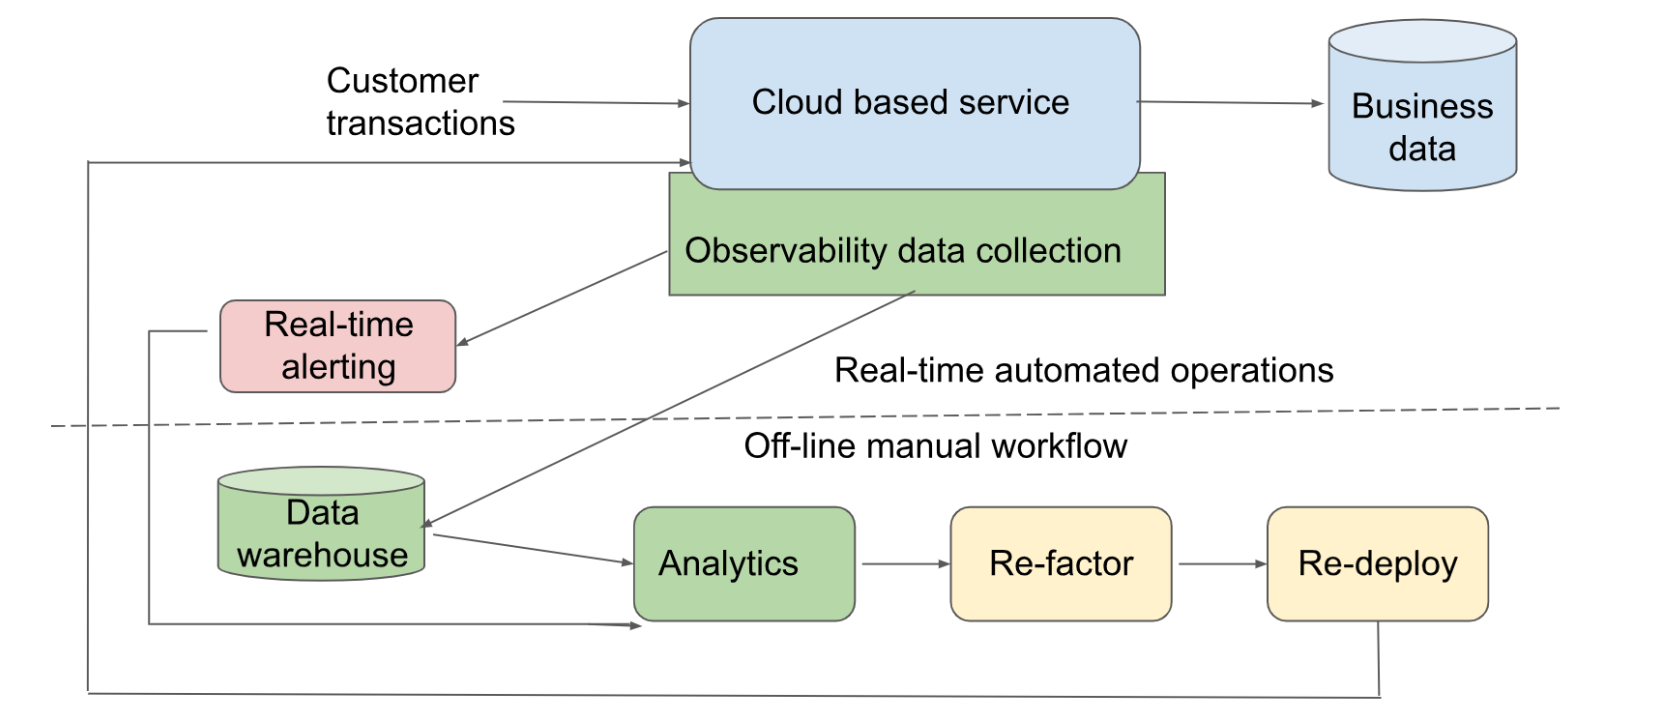
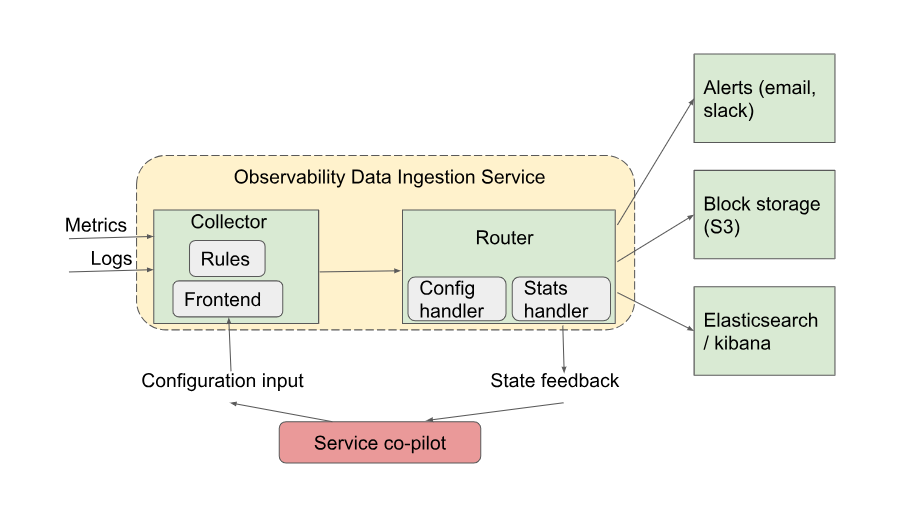
As generative AI is adopted, this component will become increasingly more real-time based on the model that it uses to “understand” the underlying infrastructure and service as well as patterns of observability data that passes through it. Such real-time analytics will be part of “service co-pilot” components as shown in the above figure. If these components could co-locate with ingestion service on the edge of a network, it can solve multiple hard problems that currently require manual intervention:
- Real-time incident response and remediation
- System health and capacity tracking and adjustment
- Pro-active response of real-time detection of patterns, anomalies, and trends
Many existing systems use AI to conduct analytics in natural languages. Let’s consider a query in plain English for Elasticsearch: "Show me all logs with a status of 'error' and originating from the 'backend-service' within the last 24 hours." To convert this user query to a valid Kibana prompt in Python, we can use the Elasticsearch DSL library, which allows us to construct Elasticsearch queries programmatically. Here is the Python code to convert this query to valid Kibana query:
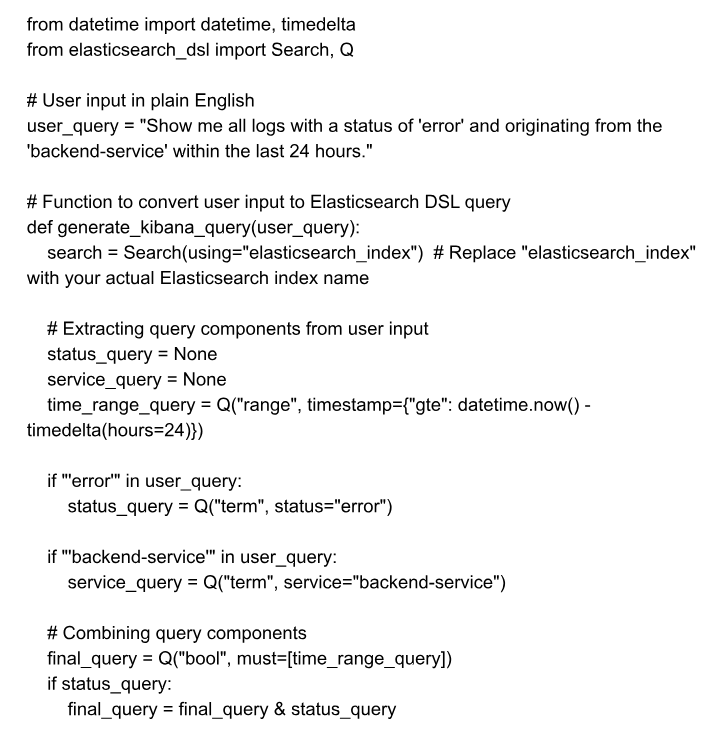
This code will generate the following Elasticsearch DSL query based on the user input:
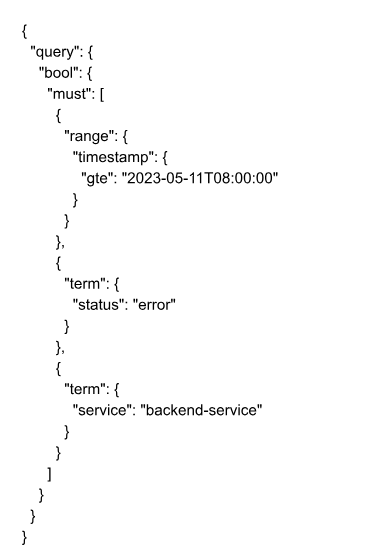
This generated query can be used in Kibana or any other Elasticsearch client to search for logs matching the user's input.
Notifications/Alerting
Near real-time analytics drives alert notifications to allow operations teams to manage production incidents. Idea behind such notifications is to catch production incidents before customers are affected by them. Mean Time To Resolution (MTTR) is the key metric that determines the reliability of operations.
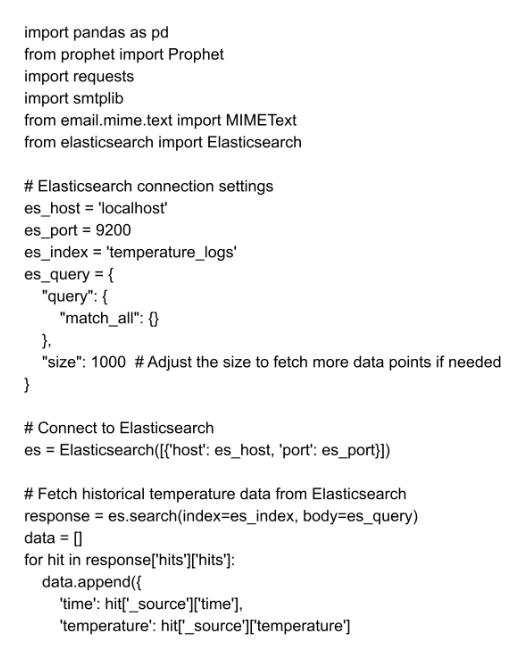
Detecting anomalies and sending out alert notifications typically involves using time-series data (i.e., metrics) and applying statistical or machine learning techniques. One popular approach is to use the prophet library, which is a time-series forecasting library developed by Facebook, to identify anomalies in data. For alert notifications, we can use the smtplib library in Python to send email alerts. For the following example, historical data consists of logs of system temperature in Elasticsearch. We can use prophet library to fit the historical data and predict future temperatures, so that if future temperatures are expected to cross safe operating thresholds, alert notification is sent through email.
Using metrics forecasting allows site reliability teams to get alert notifications even before a threshold is reached. This should result in avoiding an incident altogether. AI can also help isolate noisy alerts from real ones.
Auto-remediation
Automating incident resolution and proactive remediation can minimize the production incidents that impact end users. It can also offload SRE teams from dealing with alert overload through manual triaging.
We can continue with our alert example where we collect server chassis temperatures to alert SRE teams. Instead of alerting, we can have an automated remediation system that can periodically extract temperature metrics and as it detects that it is approaching high threshold, it can take auto-remedial action. For instance, in this case, it can be lowering the CPU frequency so that heat generation may subside. While it may not resolve the root cause, such as a faulty fan or airflow, it will ensure business continuity. Support personnel can schedule downtime to fix the problem without causing any disruption.
To implement a remediation service, we can create a Python application that listens for metric data from another service, checks if the temperature is expected to cross a threshold, executes CLI commands to lower the CPU frequency if needed, and responds with success. For this example, we will assume that the metric data is received through a WebSocket connection.
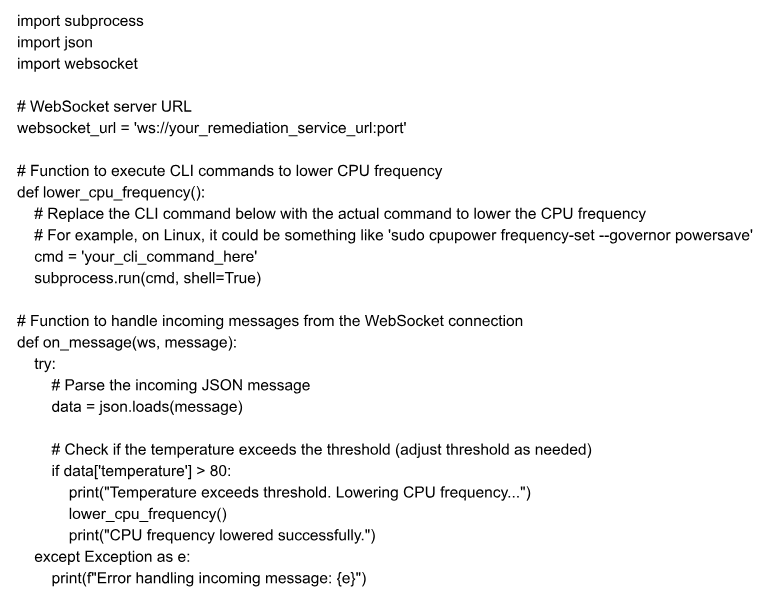
In this remediation program, we use the websocket-client library to create a WebSocket client that connects to the WebSocket server URL (websocket_url) to receive metric data. The on_message function is called whenever a new message is received from the WebSocket connection. In this function, we parse the incoming JSON message, check if the temperature exceeds the threshold (assumed to be 80 in this example), and if so, execute the CLI command to lower the CPU frequency using the lower_cpu_frequency function.
In this extensive exploration, we delved into the transformative potential of generative AI on various facets of observability. The emergence of AI has brought forth a paradigm shift in observability, empowering it to be an active participant in system operation. This evolution was illuminated through a proactive feedback loop, catalyzing real-time problem detection, root cause verification, and even autonomous remediation. We began by envisioning automation of instrumenting applications and services to generate required observability data. We embarked on an illuminating journey of anomaly detection and alerting, leveraging the prowess of time-series forecasting with the 'prophet' library and integrated email notifications for actionable insights. Concluding this exploration, we fortified the observability landscape with a responsive remediation program, demonstrating how WebSocket communication can trigger dynamic CPU frequency adjustments in response to impending temperature anomalies. These strides collectively underscore the compelling impact that generative AI is poised to have on the intricate interplay of observability's vital sub-functions, promising a future where real-time data-driven decisions lead to operational excellence.
Use of Observability in AI Systems
Observability allows developers and users of complex systems to deal with complexity. Since AI systems are very complex, observability has been playing a key role in their development and adoption.
Developer Insight
How observability provides crucial insights into AI model behavior and performance during development.
Performance Measurements
Leveraging observability to assess AI model efficiency, accuracy, and resource consumption.
Comparison of Alternatives (A/B Testing)
Utilizing observability to evaluate the effectiveness of different AI models through controlled experiments.
Infrastructure Capacity Usage and Planning
How observability aids in understanding AI model resource requirements and capacity planning.
Logging Chain-of-Thought
Utilizing observability to log the decision-making process of AI models, improving interpretability and safety.
Security Monitoring
Applying observability to detect security threats and vulnerabilities in AI systems.
Compliance Monitoring
The role of observability in ensuring AI systems adhere to regulatory and compliance standards.
The integration of AI and observability marks a significant milestone in the evolution of software-based services. In this blog series, we will explore the myriad ways AI transforms observability sub-functions, paving the way for more efficient, proactive, and reliable monitoring practices. Additionally, we will delve into the indispensable role observability plays in supporting AI systems, ensuring their effectiveness, interpretability, and security. Join us on this journey as we uncover the fascinating interplay between AI and observability, and how it propels us into a new era of intelligent software solutions. Stay tuned for the next installment, where we explore how AI is revolutionizing instrumentation and data collection in observability.